UX Case Study
Plan Selling Plugin
My UX Case Study for Over-optimized (Webinar) Plugin for Plan Selling - OOPS. I started with UX research, then I built 🎨 Figma prototype, after which, I built PoC ⚛️ React App and connecting it with Stripe API for easy checkout. (React Context API, Vanilla CSS).
Overview
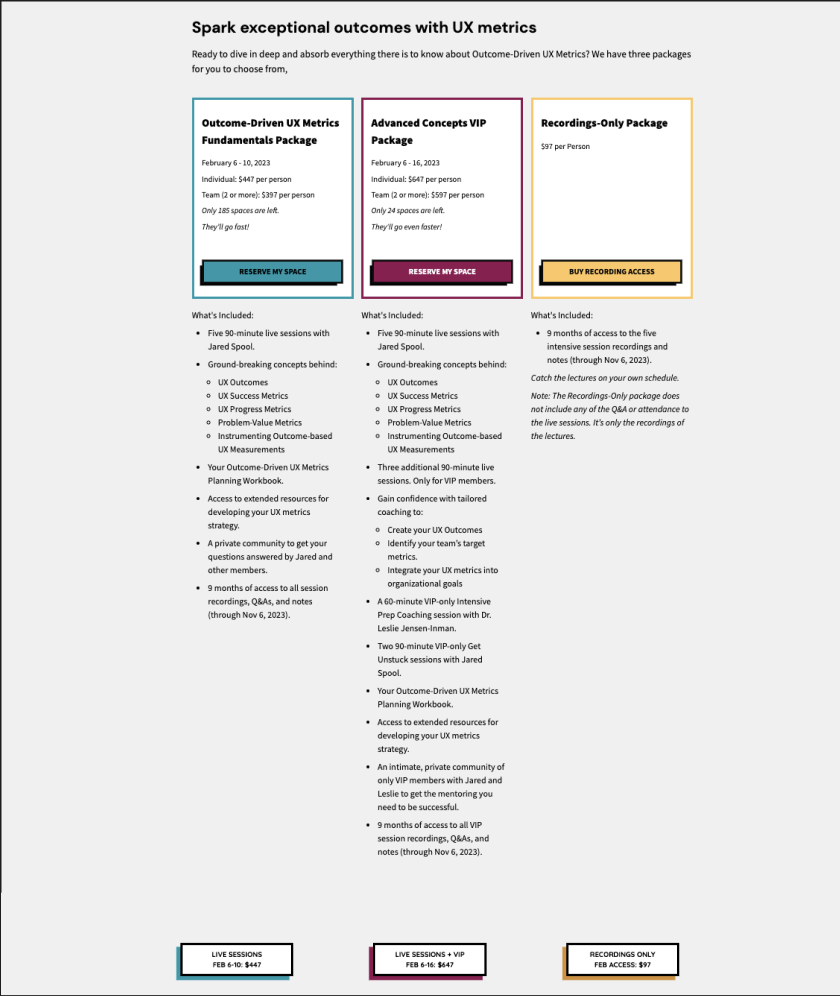
CC provides online training sessions to larger organizations with in-house UX teams. On February 6th, 2023, the company was planning to launch a 5-day long, paid webinar.
To ensure a personalized and VIP experience for our clients, we have limited the number of seats available to 50 for the VIP package and 250 for the Fundamental package. A marketing team planned to use scarcity to create a sense of urgency and drive sales.
After conducting UX research with the help of web development fellows Henry, Amy, and Shayne, I proceeded to create a Figma design, which I then used to develop a proof of concept (PoC) application using React, Express.js, and StrapiAPI.
Thanks


The Problem
Our ticketing system was overflowing with complaints, due to an extraneous and unorganized overload of information. Clients were purchasing the wrong plans, or they needed additional information after their purchases. A vast number of clients were ready to buy the plan, but they refrained from doing so because they required further clarification.
Business
Problem
User Goal
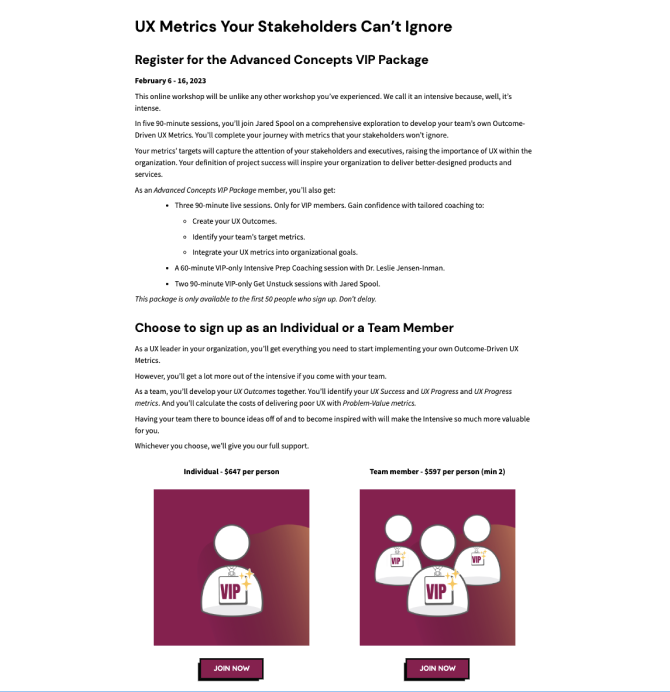
We want to empower users to quickly evaluate the best webinar plan for their team needs while minimizing buyer’s remorse.
Business
Goal
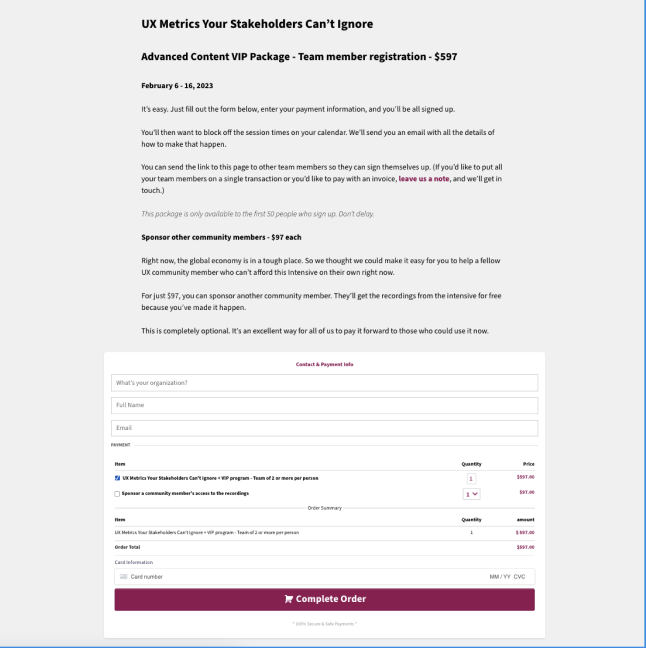
We want to ensure that all users with buy intent can finish the purchasing process while minimizing buyer's remorse, or additional customer support requests.
Metrics We
Track
UX Metrics
-
Task Completion Rate - The number of users who purchased the plan (and received receipts) divided by the total number of attempts (clicks on "buy a plan" that resulted in landing on the second page).
-
User Error Rate - The ratio of customer support tickets reporting issues with incorrect products to the total number of users who purchased the plan.
-
Time-on-Task - The average duration between when a user, who purchased the program, arrived on the product page ( metrics.centercentre.com ), and when the final member of their team joined the paid space (after being invited and accepting the invitation).
Metrics Sales Team Tracks
-
When did we sell out VIP plan seats? (how many days before the start of the event).
-
How many VIP and Fundamental plan seats we have sold in the first week?
-
How many Fundamentals plan seats we sold in the first month?
-
How many Fundamental seats we have sold in the week ahead of Intensive?
(* since webinars have different topics, marketing is collecting this data so that they can compare ratios between different webinars)
Design
Principles

Personalization
The interface is being adapted to correspond with the choices made by the user.

Progressive Disclosure
Information is presented gradually, only as needed when the user needs to make a decision.

Limiting Regret
At any time users can change their decisions.
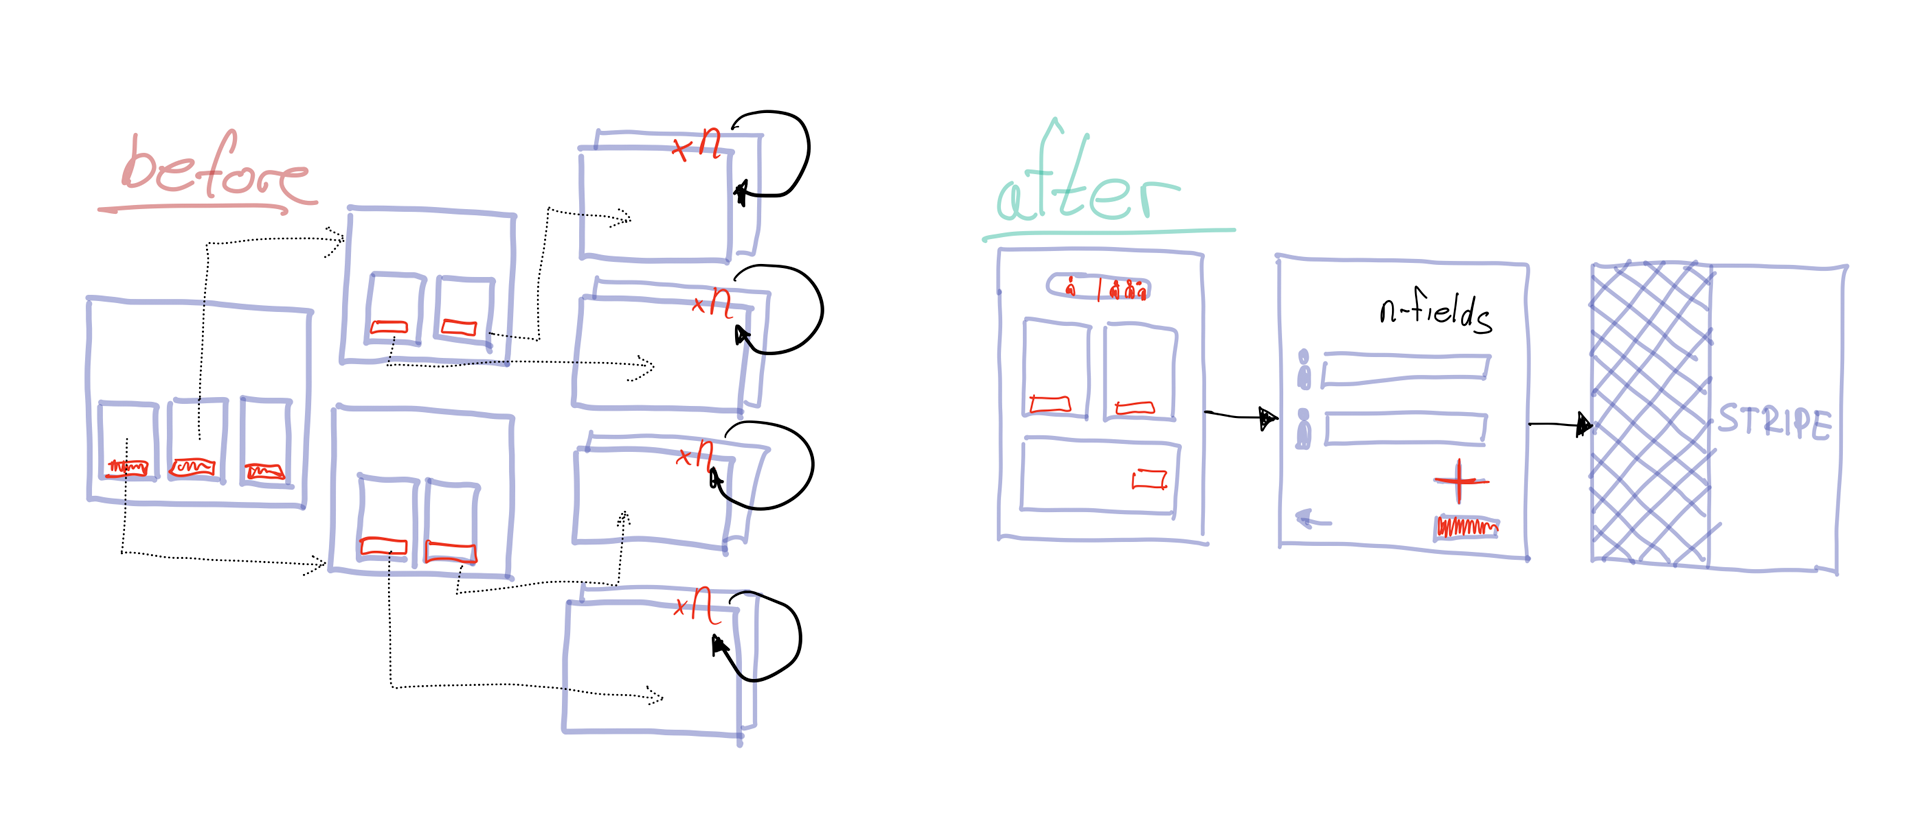
How the Old System
Worked
How the New System
works
Result
With the new system, users can more easily understand which plan their team needs. They can move through the system faster since they only pause when they have to make an important decision. The system is handling all smaller decisions and processes complex tasks in the background (inviting/adding users, calculating total and per seat price). Personalized experience helps users make the best decision for their team.